We killed the spreadsheet bottleneck in location intelligence
Mapfry owns the best geomarketing dataset in the market. But their users? They were stuck copy-pasting into Excel to make sense of it. We designed Studio, a visual interface that finally lets expansion teams analyze location data without ever leaving the platform. No exports. No formulas. Just decisions.
Big Numbers
60%
Faster analysis cycles
90%
Adoption in 6 weeks
100x
More locations evaluated
The Challenge
Mapfry had the data goldmine. But every time an agent wanted to find the perfect store location, they hit the same wall: extract data → export CSV → wrangle filters in Excel → hope you didn't break something.
This wasn't just slow. It killed momentum. The best database in the business was being filtered through the worst possible interface. Our brief was simple: make the power of a spreadsheet feel like using Figma.

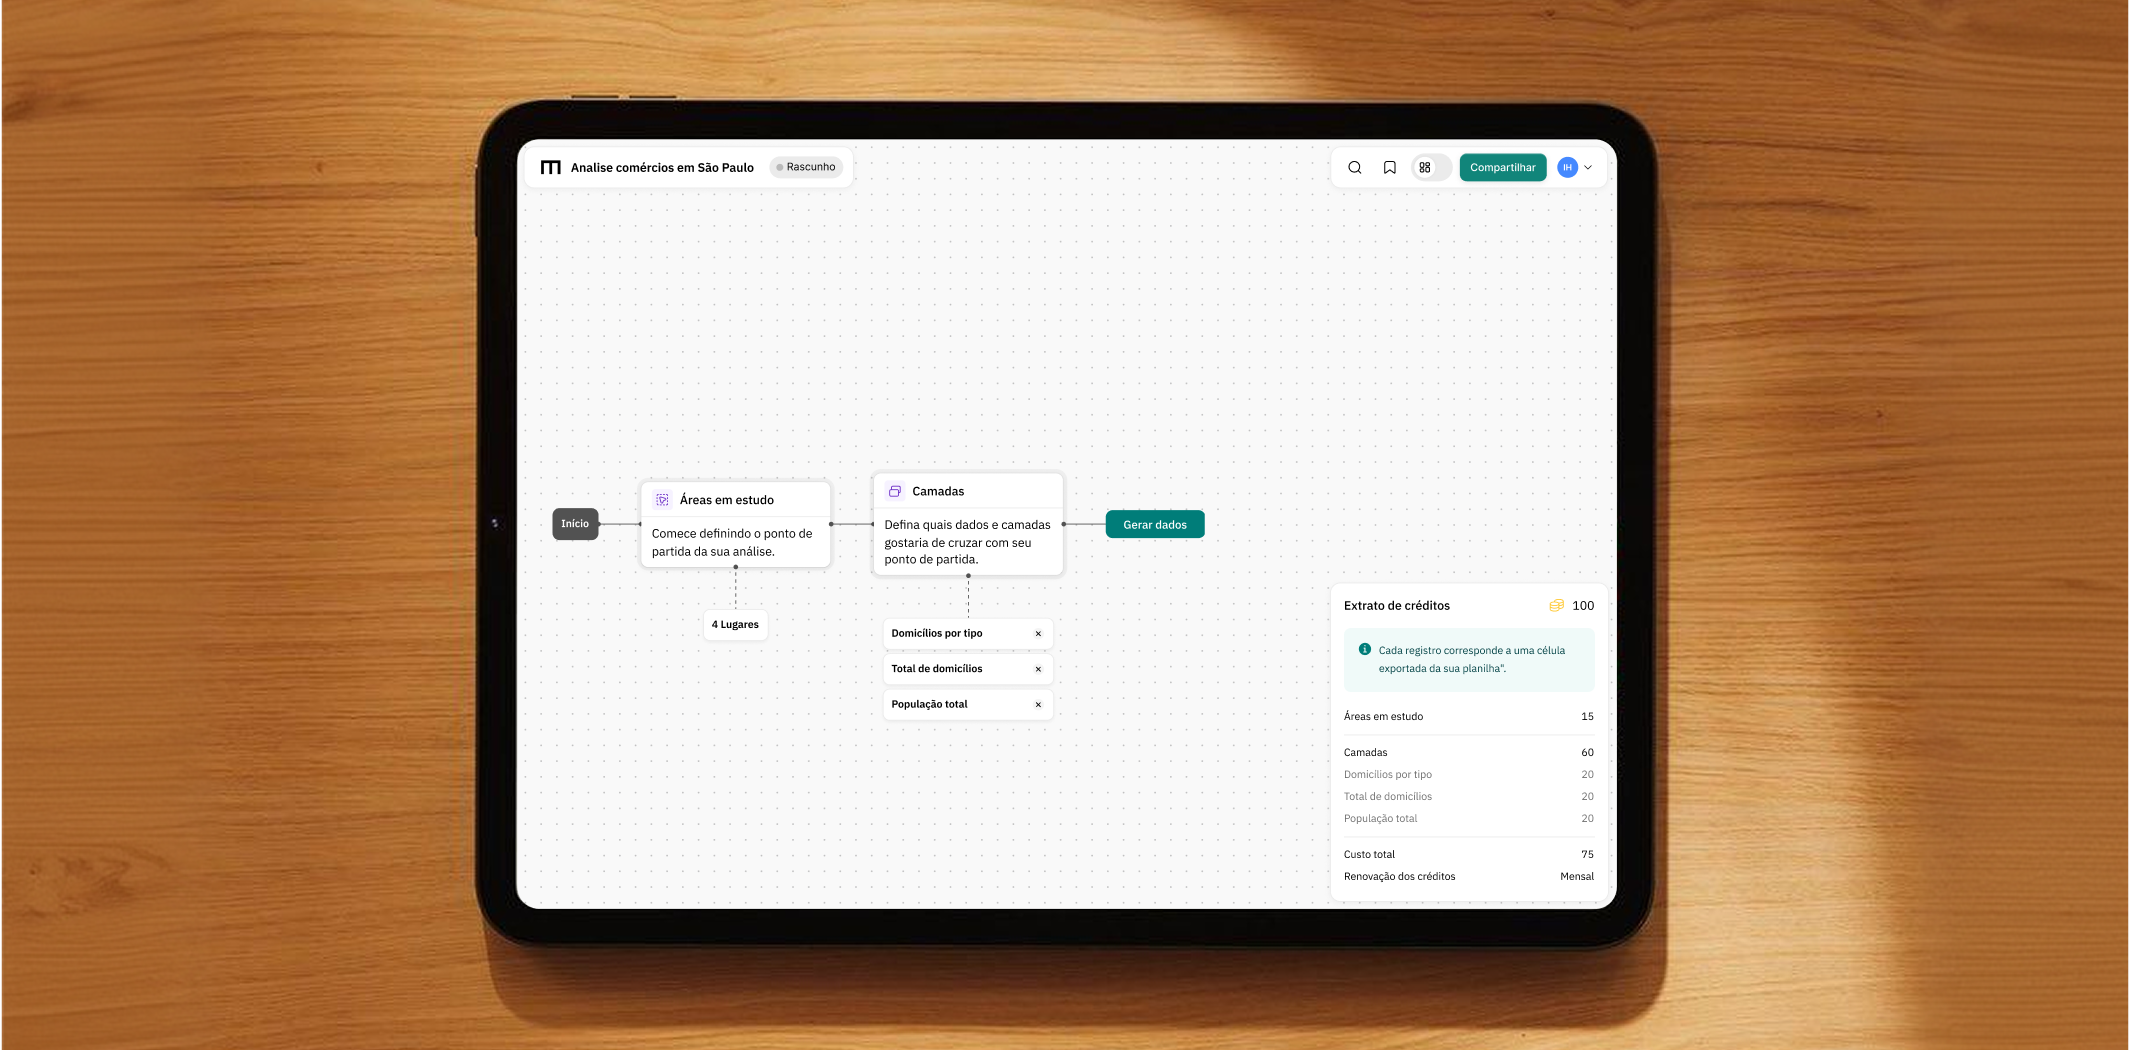
Our Approach
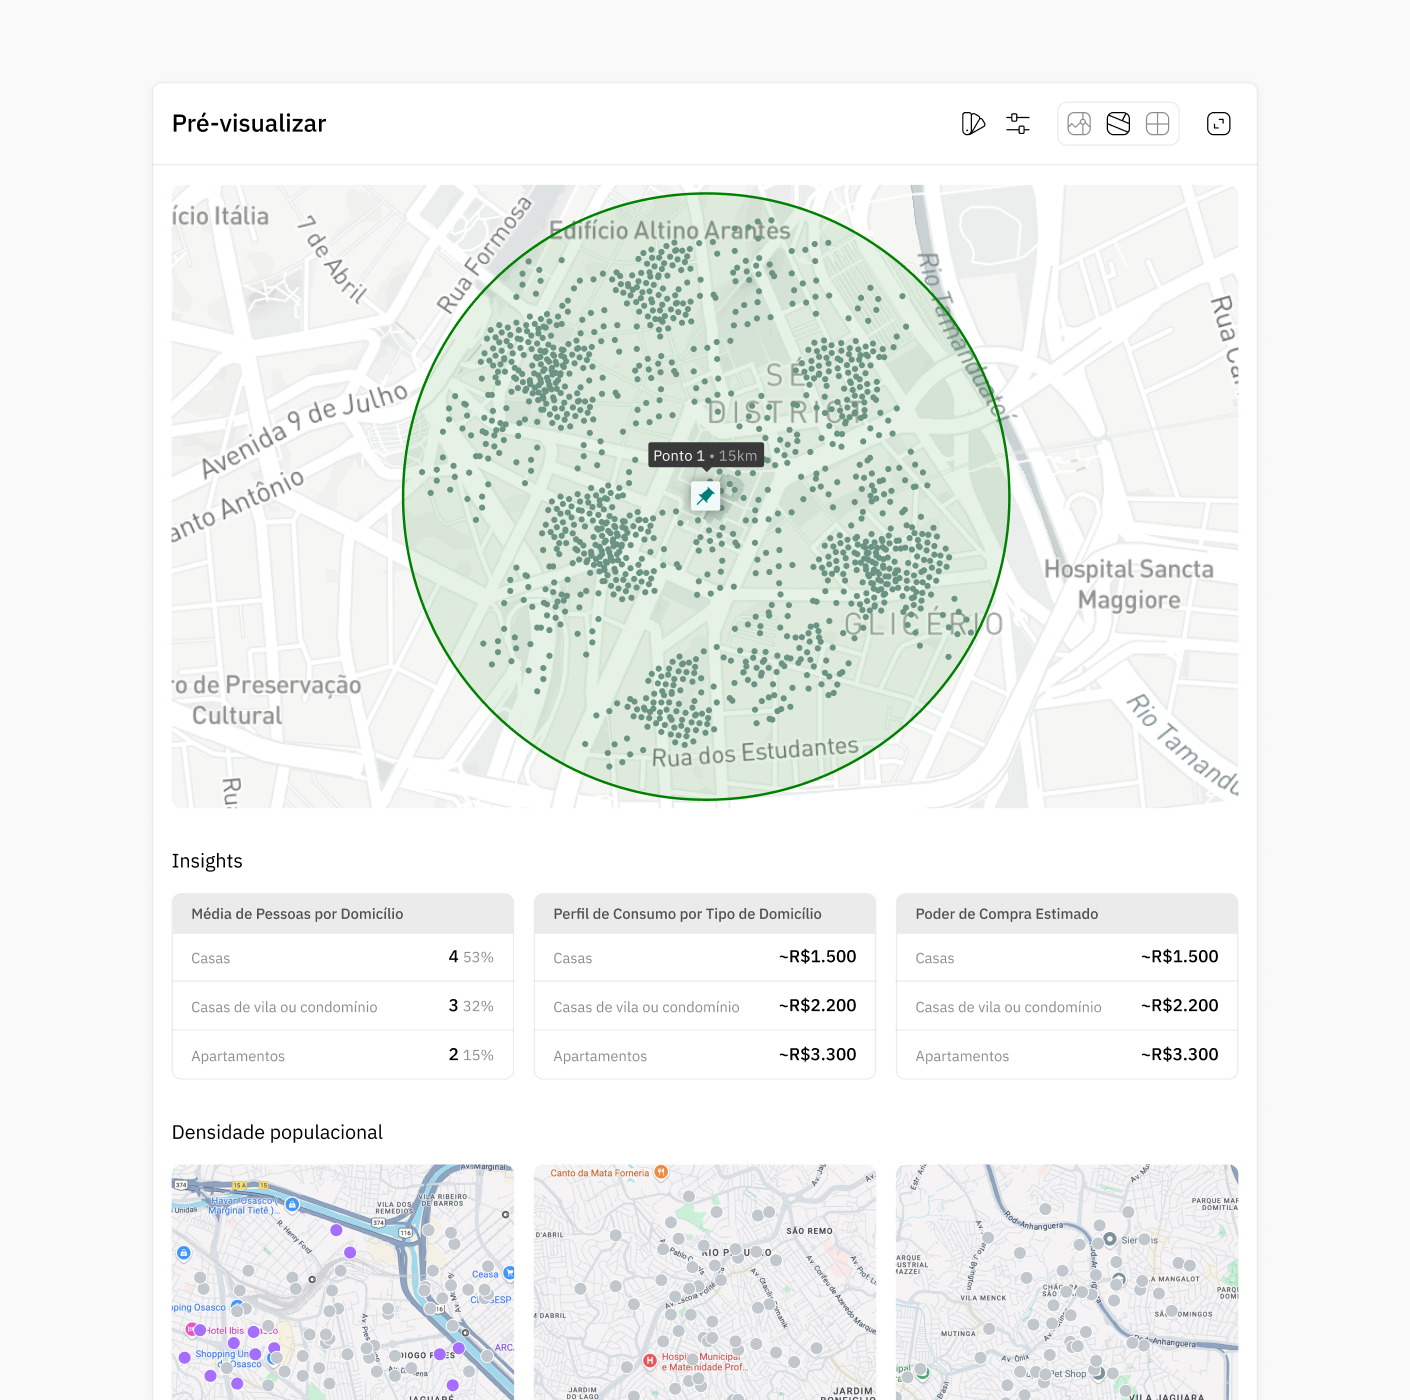
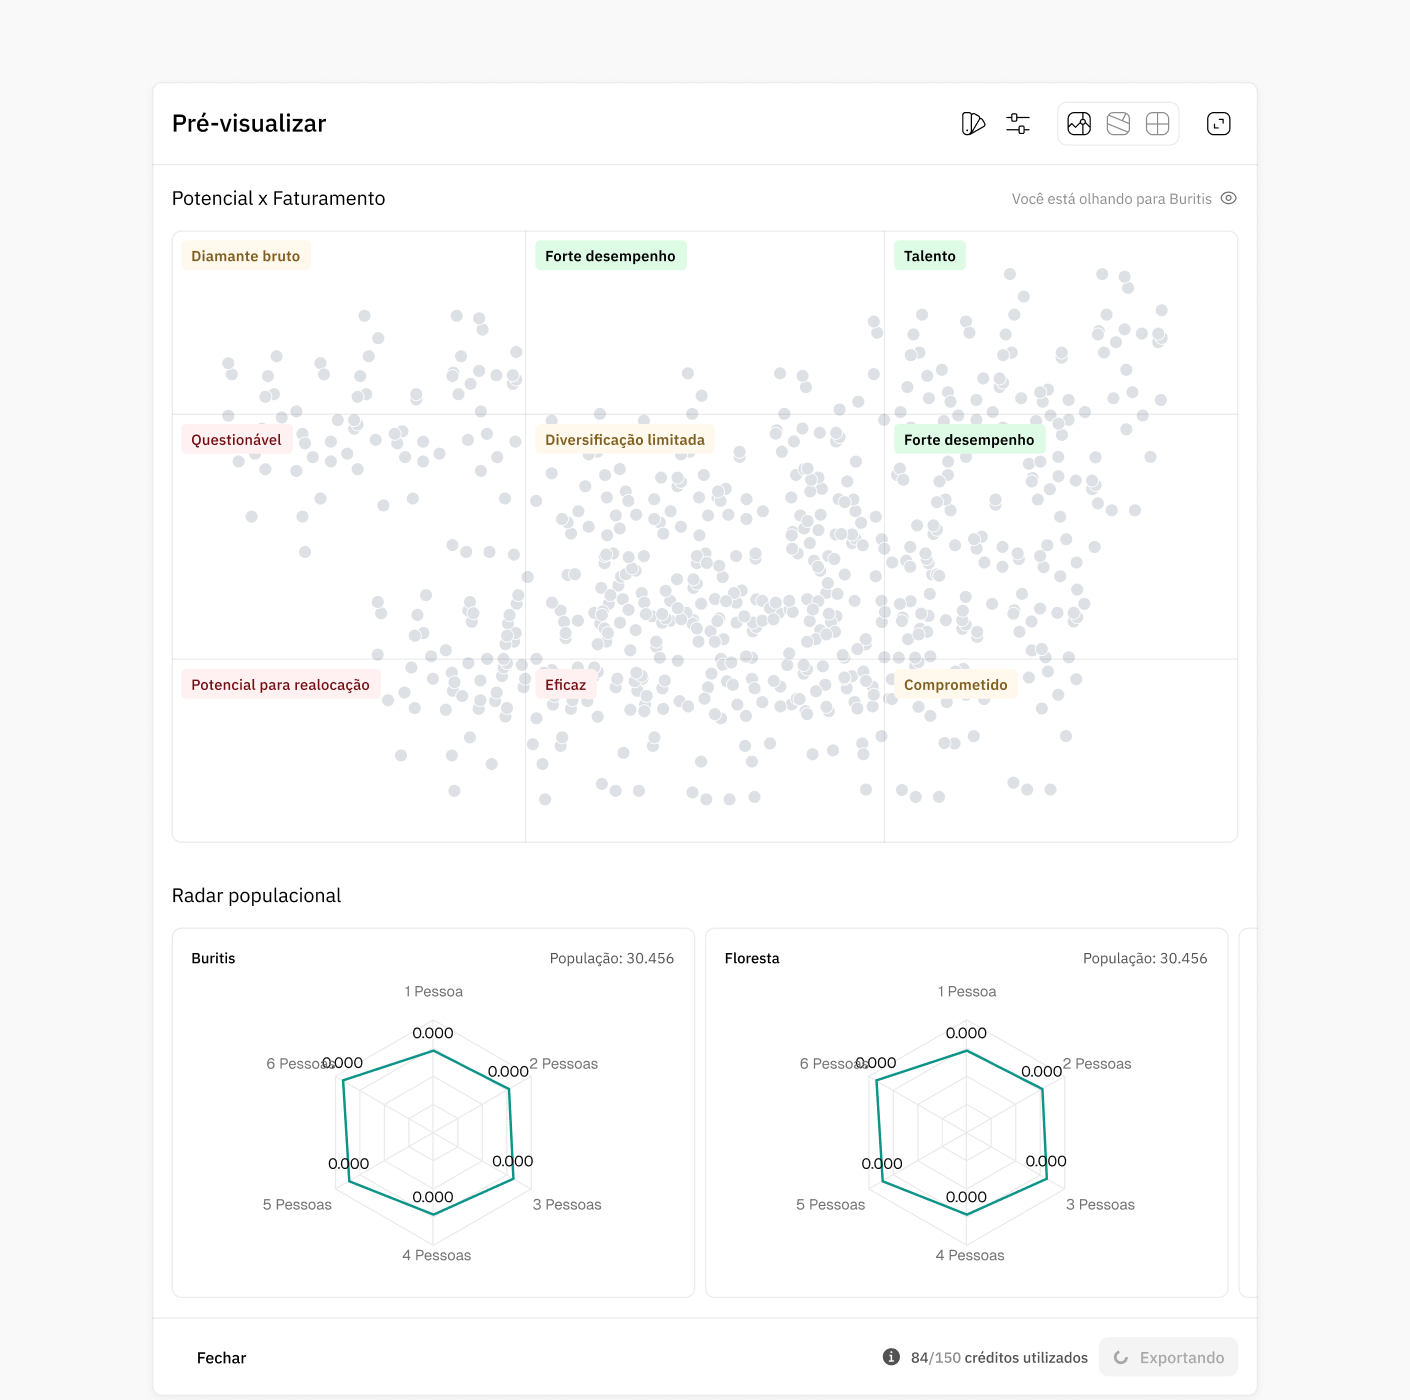
Forget tables. We built Studio around flow diagrams, because finding a location isn't a static calculation. It's a layered exploration. Here's what we shipped: Drag-and-drop logic: Users pull in data nodes (foot traffic, income levels, competitor density) and visually connect them. Want to see high-income areas near transit with low competition? Just wire it up. Zero backend drama: The system processes everything in real-time. No waiting. No exporting. No "Did I filter this right?" anxiety. The grid they already know: Output lands in an interactive data table that looks like a spreadsheet, works like one, but with intelligent native filters baked in. Familiarity without the friction.

"Bossa didn’t just redesign an interface, they helped us translate a complex methodology into something lightweight, intuitive, and evolutive. Studio started teaching as it was being used. That fundamentally changed the user’s relationship with the product and explains the almost immediate adoption we saw."
- Founder & CEO, João Caetano